
Real-time productivity monitoring: The data berry growers need to make decisions during the workday
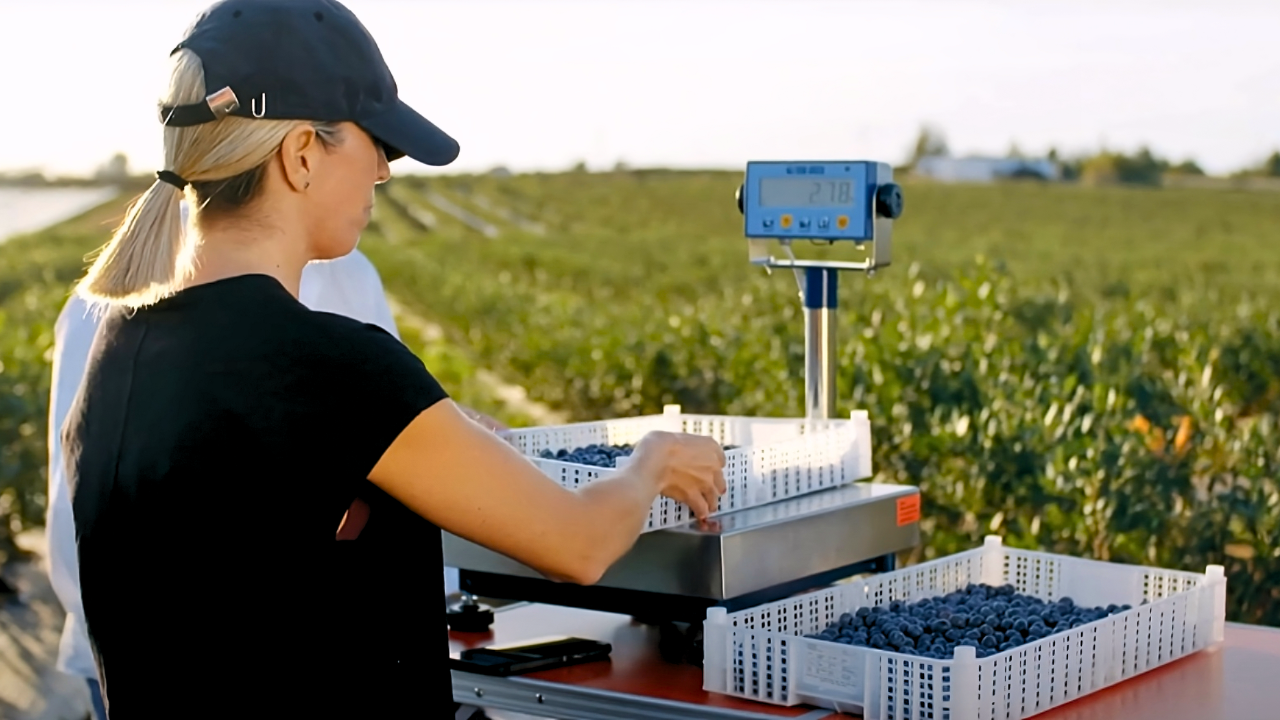
During a blueberry harvest day with several crews in the field, data is generated non-stop: kilos picked, hours worked, workers per crew, plot and variety. Hour by hour, these figures shape the productivity KPIs that matter most to any berry operation, such as cost per kilo (€/kg) and kilos per hour (kg/h) at crew and worker level.
And this isn't a minor detail. Berries are highly labour-intensive crops, with harvest campaigns that stretch over many months and involve continuous, almost daily picking. In this type of operation, labour is by far the largest share of total production cost. That's why every decision — how many people are working, in which plot, and at what performance level — has a direct impact on the campaign's margin.
In most operations, however, this data doesn't reach decision-makers until the following day — or even the end of the week.
How opperational decisions are made today
The crew supervisor logs activity at the end of each picking round. That data reaches the office once the day is over, where someone consolidates it, calculates costs and generates a summary. The production manager then reviews it and, if a deviation is spotted, notes it down for the following workday.
This is the standard process across much of the sector. The data exists — but by the time it's finally available, the workday is already over: the decisions that could have been made at 10 a.m. are no longer on the table.
That's why at Agrogestia we developed a real-time productivity dashboard.
The idea is simple: something similar to an aircraft cockpit, where the pilot sees the status of every system on a single screen while the flight is underway. Here, instead of systems, growers visualise every harvest in progress: cost per kilo (€/kg), productivity (kg/h) and how each one deviates from the benchmark that the grower defines.
What happened at a blueberry farm
One of our clients spotted it in real time: one of his active crews was over the cost-per-kilo benchmark he had set.
He acted immediately, cutting the 10 lowest-performing workers from that crew the same day. The cost came back into range before the day was out.
The same insight, delivered 24 hours later, would have arrived too late to matter.
How the dashboard works
This feature came directly from what berry growers were asking for: a single screen that shows every active crew, with cost per kilo calculated automatically and compared against their own benchmark — while the harvest is still in progress.
For each active crew, the dashboard calculates cost per kilo in real time from the weight readings captured automatically. Every reading is linked to the worker, the crew, the plot and the variety at the exact moment it happens. The system then compares that cost against the grower's target and flags which crews are within range and which ones are over, showing the deviation percentage and the time of the last entry.

What data you get, and when
During the workday, at crew level:
- Cost per kilo (€/kg) and productivity (kg/h), compared against your benchmark.
- Kilos picked, hours worked, number of workers and total cost per crew.
- How each of these evolves as the day progresses.
At the close of the campaign: a complete historical record by crew, farm, plot and variety — built automatically as each workday unfolds, with no manual data entry.
Real-time data always makes a difference. In a challenging campaign — with adverse weather, rising input costs or a tight labour market — it's what separates growers who react in time from those who find out too late.
Want to see your harvest data in real time? Book a free demo of Agrogestia
Other similar items
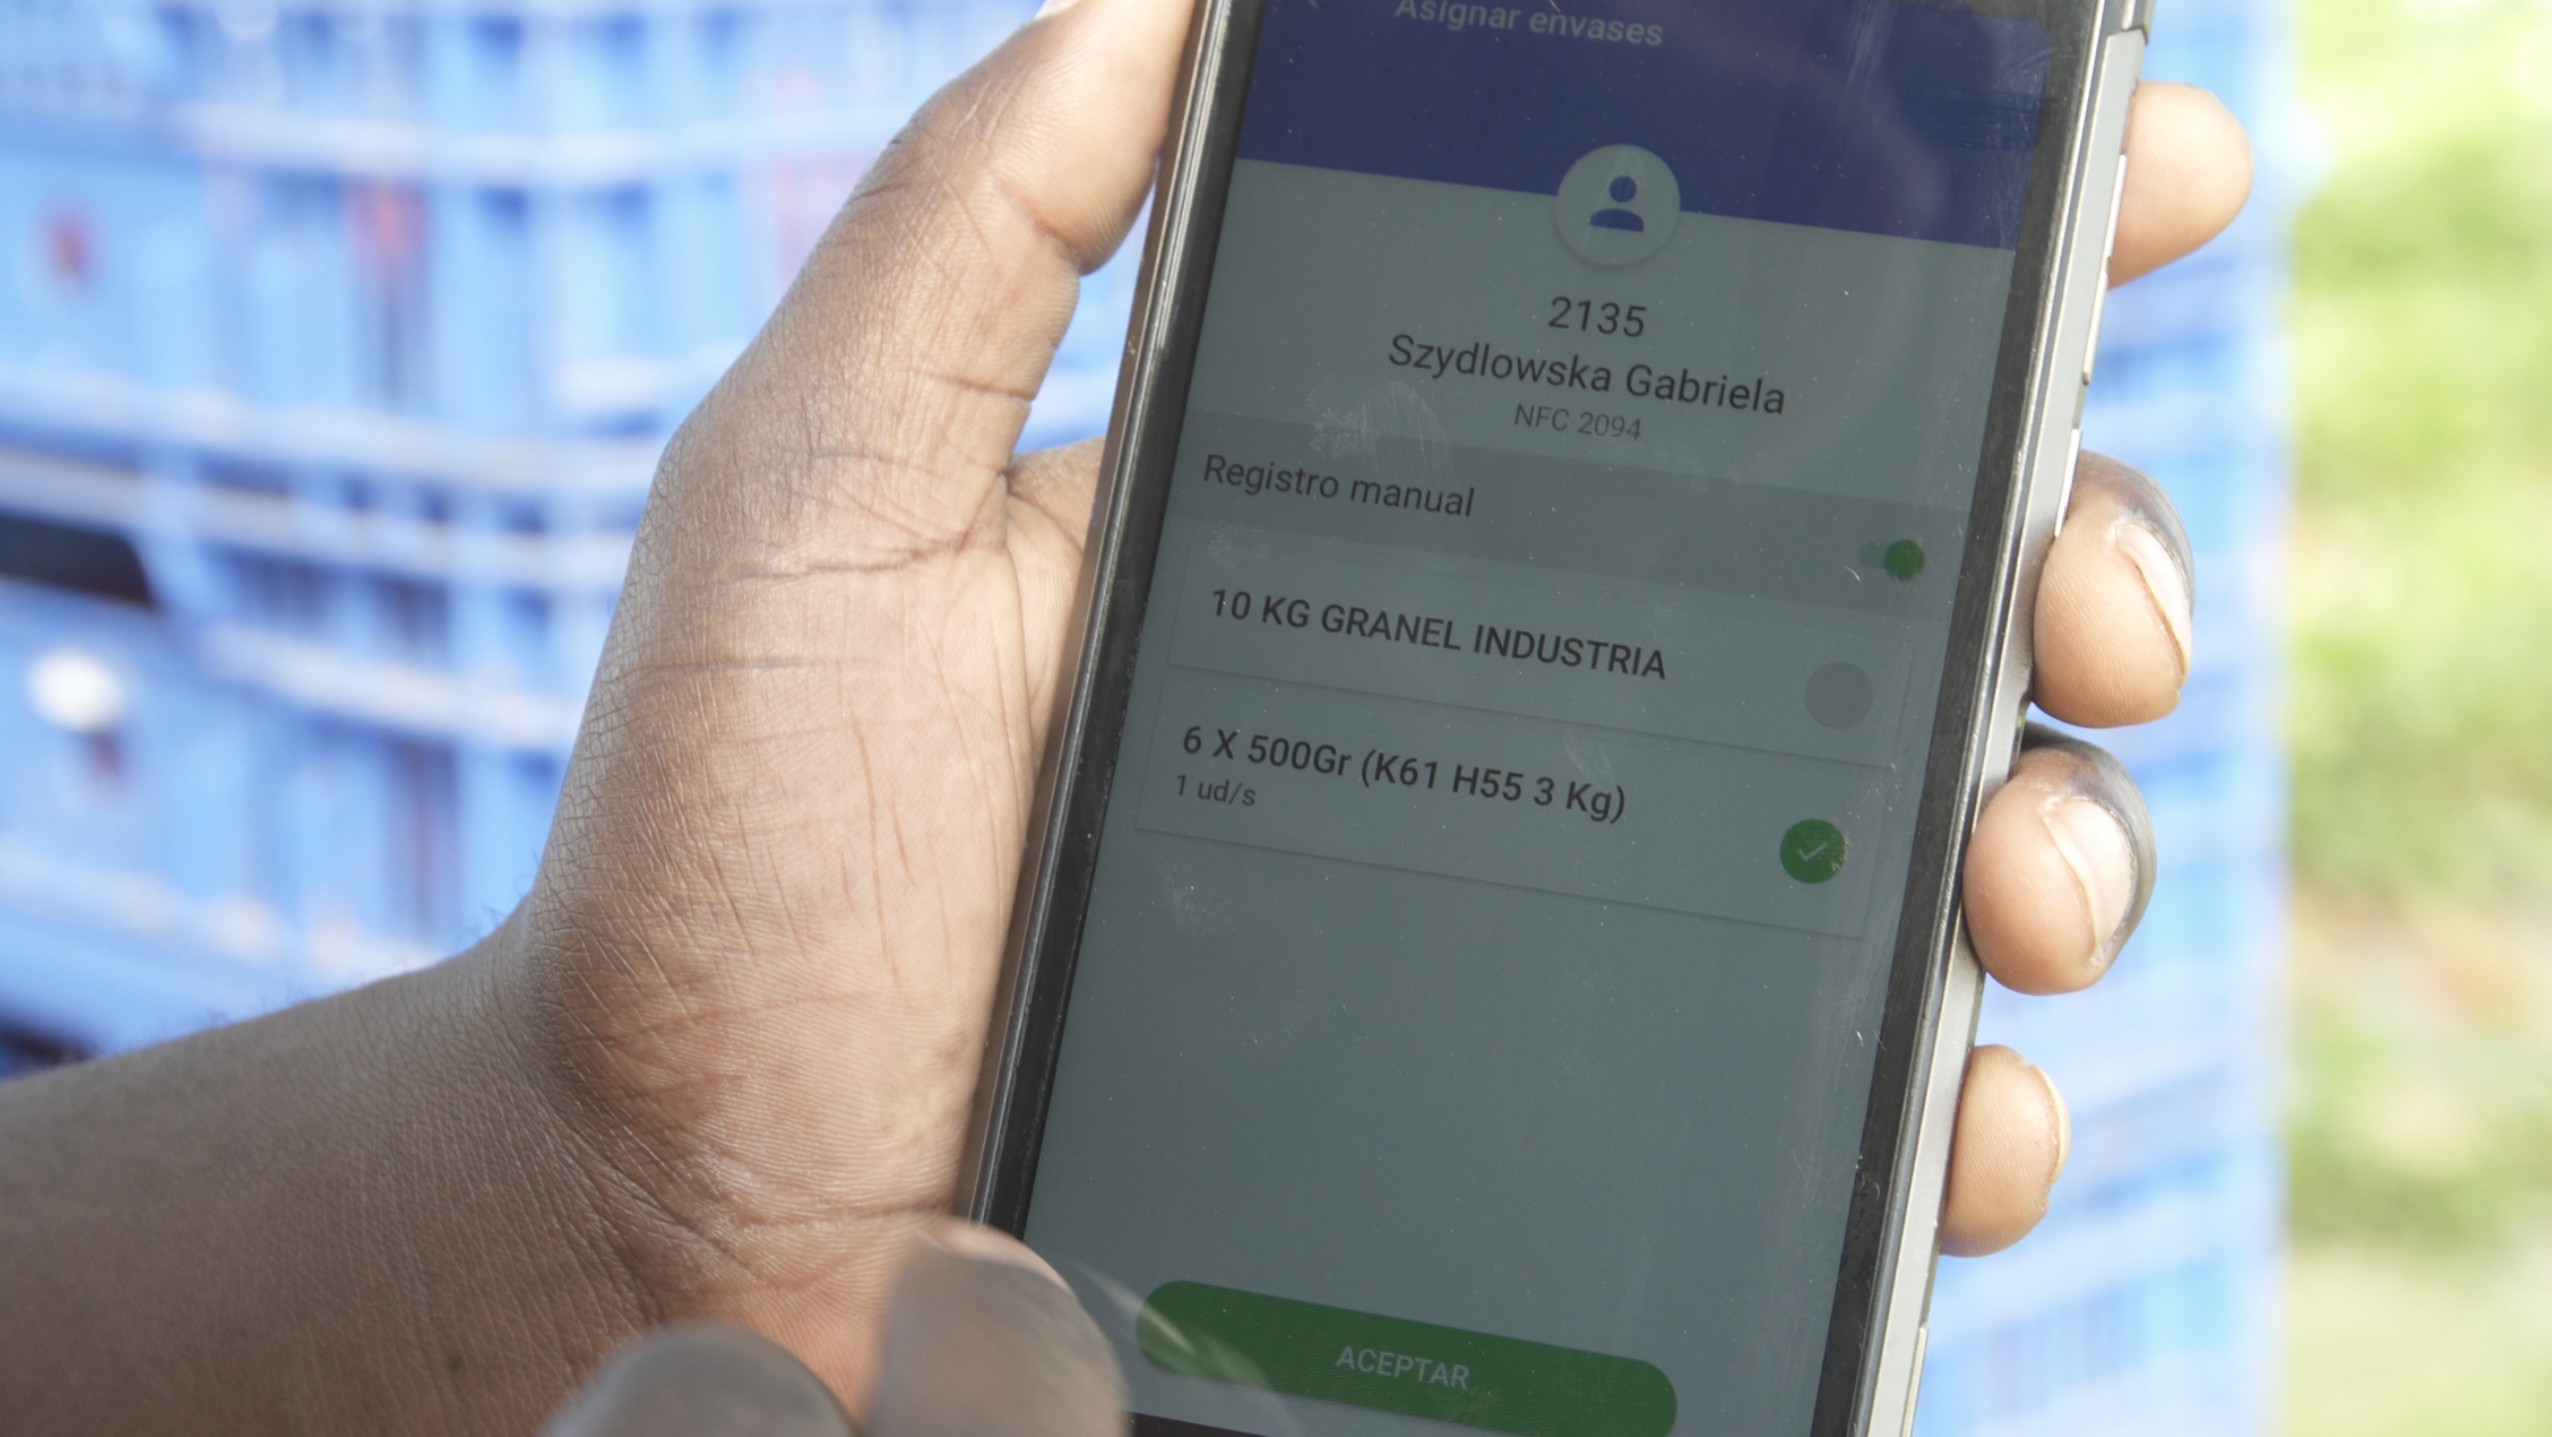
From paper to real-time data: how agricultural companies are changing the way they manage their farms
Paper parts, spreadsheets and manual transfers to payroll: a model that many agricultural companies maintain by inertia without calculating how much it actually costs them. We analyze why farms that do not rely on agricultural management software are left behind and how digitalization is transforming productivity, cost control and decision-making in the field.
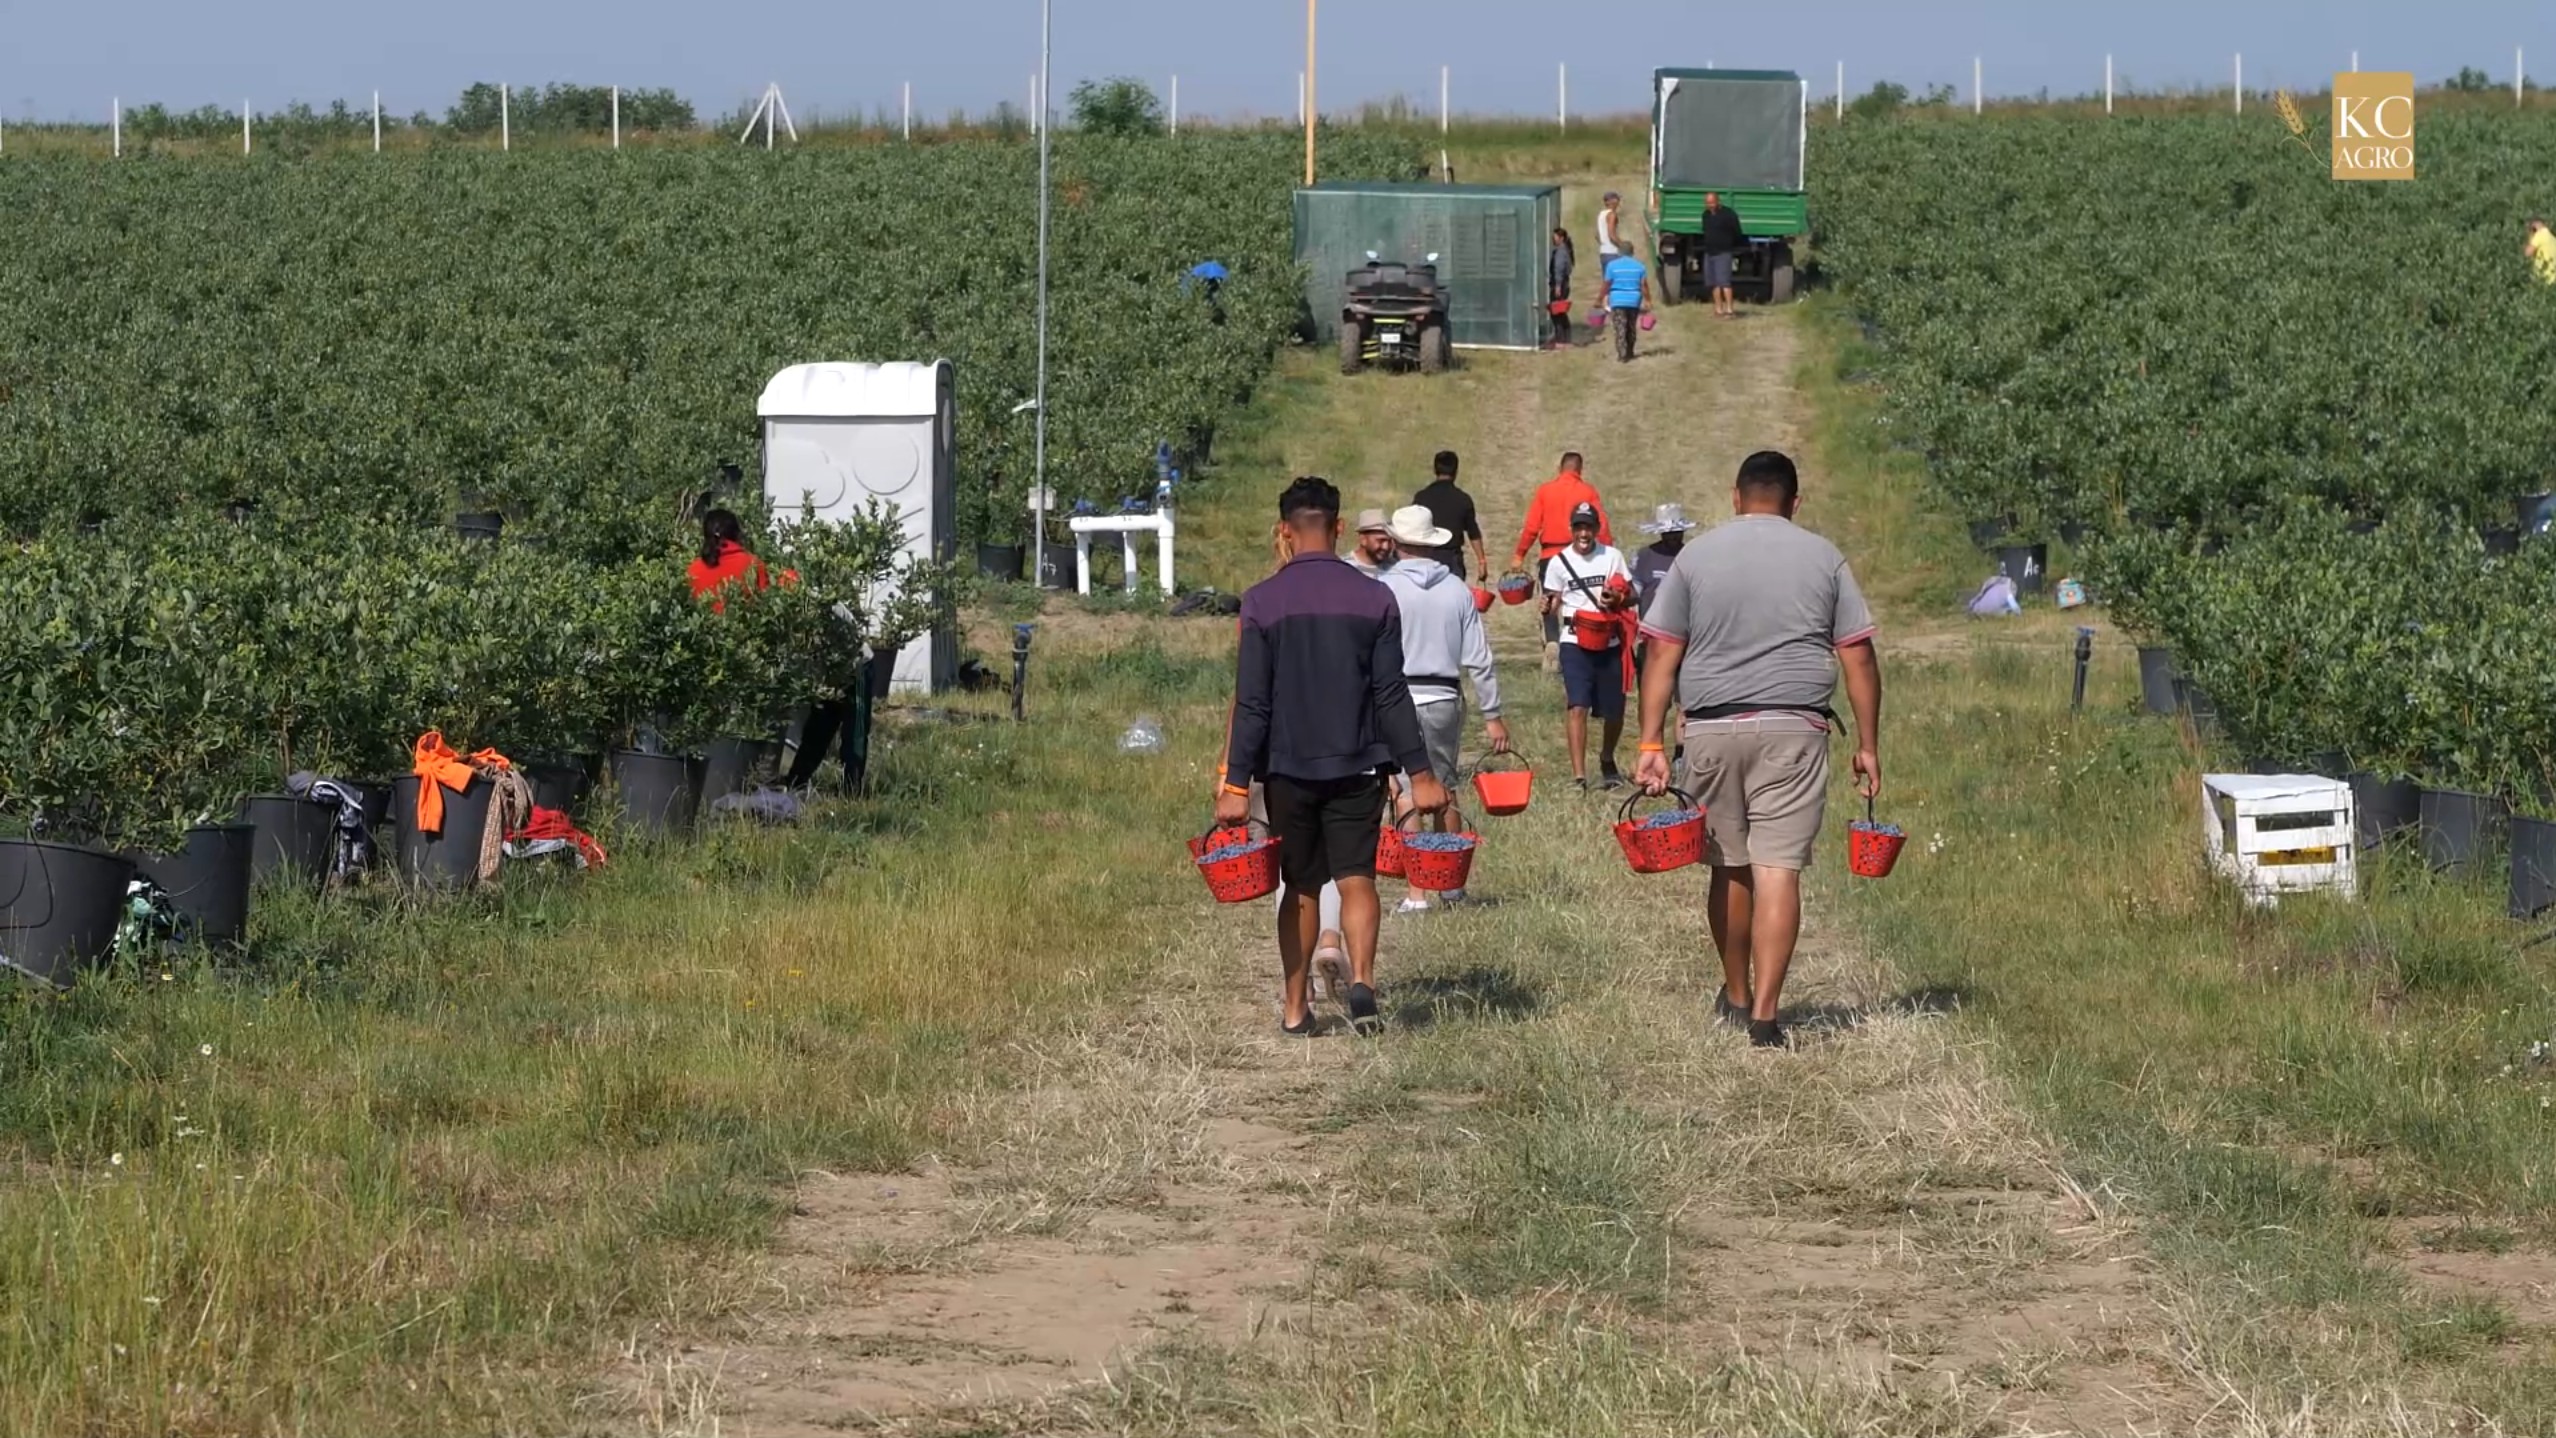
Agricultural digitalization without borders: how two blueberry producers in Romania went 100% digital — managed remotely from Spain
Oltenia Berries and KC Berry, two blueberry producers in Romania, chose Agrogestia to digitalise their farm management. Both discovered the platform at Fruit Attraction and completed the setup 100% remotely from Spain, with the system adapted to Romanian and local labour regulations. Their experience shows that distance is no longer a barrier: what matters is having farm management software that understands the sector and adapts to the reality of each market.